Jonathan Bales is the founder of TheDCTimes.com
and writes for the New York Times and Dallas Cowboys. He’s
the author of Fantasy
Football for Smart People: How to Dominate Your Draft.
In my last article, I explained
how to utilize consistency and volatility to your advantage on draft
day, detailing why a quarterback should be a legitimate option for
you in the first round. Today, I want to take a look at the exact
consistency correlations I uncovered while writing my
book Fantasy Football for Smart People.

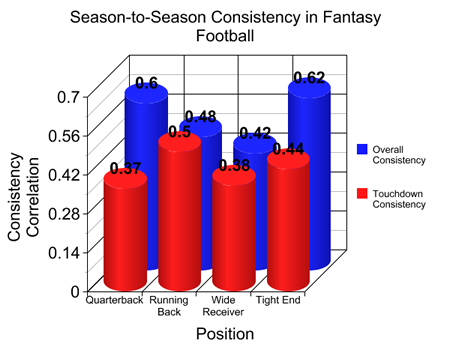
Above, you can see the season-to-season consistency of touchdowns
and overall fantasy points for each skill position. Note that quarterbacks
are the second-most consistent players in fantasy football, just
behind tight ends. On average, 60 percent of quarterback fantasy
points carry over from year to year, with the other 40 percent regressing
toward a league mean.
In addition to the 0.37 correlation strength of passing touchdowns
between year Y and Y+1, let’s take a look at the correlations
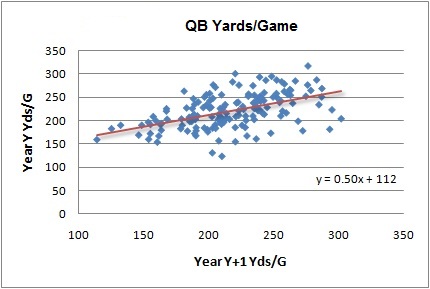
of other quarterback statistics. Below, you can see the consistency
of passing yards from one year to the next.

At 0.50, the strength of the correlation is greater than that for
touchdowns. With a larger sample size of plays (all passes versus
passes with a legitimate threat of scoring), this makes intuitive
sense.
For fantasy owners, this means you can be more confident in your
passing yardage projections than your touchdown projections. It
isn’t that touchdowns don’t matter; actually, they’re
more influential than any other stat because the touchdown disparity
between elite passers and average ones is so vast. Without strong
predictive ability, however, the degree to which a stat should affect
your rankings is minimal.
Think of it like this; imagine passing touchdowns were worth 100
points in your league so that whoever secured the league’s
top touchdown-throwers was basically guaranteed a championship.
Also imagine that the strength of correlation for year-to-year passing
touchdowns was 0.0, i.e. impossible to predict. With no ability
to accurately project passing touchdowns, they should have zero
influence on your rankings. In this extreme scenario, you can see
why it isn’t simply good enough to understand the probable
outcome for each player (your projection); you also need to know
how likely the player’s production is to deviate from your
projection (and to what degree).
You might be asking from where the high 0.60 strength of correlation
for quarterback fantasy points arises. While passing yards remain
pretty steady from year to year, the most consistent statistic in
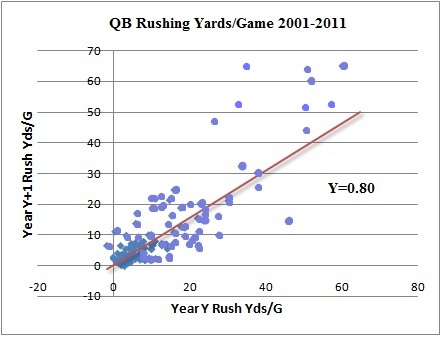
all of fantasy football is quarterback rushing yards.

Above, you can see that an incredible 80 percent of quarterback
rushing yards carry over from one year to the next. This has a profound
impact on fantasy football projections; rushing quarterbacks such
as Cam Newton who are widely considered risky propositions might
not be as much of a gamble as you think. Since the general fantasy
public analyzes primarily passing stats when ranking quarterbacks,
there’s certainly an opportunity to leverage the most consistent
fantasy stat, quarterback rushing yards, into a competitive advantage.
Finally, consider interceptions. From a defensive perspective, there’s
a mild correlation between interceptions from one season to the
next. From the perspective of individual passers, however, there
is almost no correlation. For all intents and purposes, you’d
actually be better off ignoring interception projections altogether
than giving them the same weight as other passing statistics. That’s
not to say that you shouldn’t project interceptions, but rather
that you can’t be as confident in that prediction as your
projection for rushing yards, for example.
Putting It Together
In my book, I propose a formula to create power rankings at each
position based on consistency correlations like those above. In
a nutshell, I suggest multiplying your actual projection for each
statistic by the corresponding correlational strength, then adding
all of the numbers together to generate a power rating of sorts.
If you project Cam Newton to rush for 600 yards, for example, you
would multiply that total by the correlational strength of season-to-season
quarterback rushing yards (0.80).
After proceeding in a similar fashion for all quarterback stats
and adding the results, you’d have an initial power rating
for Newton. That rating is more valuable than projected fantasy
points because it necessarily implements consistency. The most consistent
positions would create the largest disparity (also known as scarcity)
in power ratings, making those positions more valuable.
Whichever method of formulating projections and rankings you choose,
consistency and volatility need to be a major part of the equation.
If not, you’ll be leaving a whole lot of fantasy points on
the table in 2012.
|

