Of course, I'm talking about fantasy. (Outside of illegal activities,
I am very much a person who supports thinking outside the box.
If that comes as a surprise, perhaps you are new to my work.)
Seriously though, how can we honestly expect to keep fantasy projections
realistic if we don't analyze things from a macro perspective?
Anyone can say David Johnson is going to get 300-plus carries
or Antonio Brown will see 150 targets, but in order to give ourselves
a chance to identify the players that typically win leagues -
those middle-to-late rounders who outperform their draft position
- it helps to be able to see how their workload could actually
fit into the construct of their actual NFL team for the coming
season.
Over the last two weeks, I went through the process of breaking
down offensive coordinator tendencies in the AFC
and NFC, highlighting
backfield and target shares. That work set the table for this
week, as I attempt to use that information to lay the foundation
for how much players might be utilized this year. The problem
with a lot of fantasy football projections is the math doesn't
add up to a realistic team total in the end. Unless you are keeping
a close eye on the overall play total for every team in a computer
program (like I do with Microsoft Excel), it's easy to have one
team finishing with 800 offensive plays and another going over
1,200 when all the individual numbers are calculated. (As a point
of reference, most teams run somewhere between 950 and 1,050 offensive
plays per season. A few will exceed 1,100, while a handful tend
to finish with just over 900.)
As I stated two weeks ago, the one area in which my attribute-based
PMA method needed to improve the most was in predicting actual
opportunity. I believe I have corrected that flaw with the work
I am doing this week, assuming it was even a problem to begin
with. It all comes to a head next week, when I begin unleashing
Big Boards like they are going out of style.
Especially for this week, I wanted to keep everything short,
simple and to the point. The goal: provide quick analysis on one
or two of the "team issues" that played a factor into
the way I divided the workload for each team. As was the case
over the last two weeks, the bolded numbers near the top are the
totals for each column. While I tried to accurately project how
many pass attempts each quarterback might throw, I ask that you
pay more attention to the actual pass attempts and less to the
individual breakdown. Also, just about every team finishes a season
with several more pass attempts than targets, so if you are wondering
why the targets and attempts aren't the same, that is why.
2017 Projected Total Offensive Plays: 1,055 2016 Total: 1,086
Let me start off by saying there is a bit too much talk about
a 1,000-1,000 season for David Johnson from the Cardinals for
my liking. With that said, they are one of the few clubs who could
win their division going away if they stay healthy or finish 4-12
if Johnson can't withstand his massive workload. In fact, there
isn't a single key player in the desert I am willing to trust
to hold up the entire season (and maintain consistent production
throughout) besides Johnson. Palmer and John Brown both carry
plenty of injury risk, while Fitzgerald can't be expected to buck
his recent trend of fading in the second half. The 160-pound Nelson
could add 20 pounds to his frame and still be considered a poor
bet to withstand the kind of punishment he is likely to receive
with five or six targets per game, while Jaron Brown is recovering
from an ACL tear and Chris Johnson lasted only four games in 2016.
Ellington is the very definition of an injury risk. What am I
saying? Say your prayers if you are counting on Arizona players
this season.
2017 Projected Total Offensive Plays: 1,016 2016 Total: 995
Anytime a team makes a change at offensive coordinator, owners
have a right to get nervous. Expecting a NFL play-calling neophyte
like Steve Sarkisian to do as well as Kyle Shanahan is ludicrous.
Expecting the Falcons to get 16 starts from all five of their
offensive lineman again this season would be ludicrous as well.
The 2016 Falcons were ridiculously efficient and it would have
been a mistake to expect Shanahan to repeat that, much less Sarkisian.
Now the good news: Sarkisian chose to learn Shanahan's system
as opposed to forcing his new charges to learn his offense. He's
made it quite clear he understands how much of a matchup advantage
his running backs give him and he has already stated publicly
Jones needs to get the ball in the red zone just about any time
the defense even thinks about trying to guard him with one cornerback.
Once the Falcons get into the meat of their schedule, they will
probably realize Jones needs to be fed the ball everywhere else
as well. (More on that next week.) An equally big takeaway (assuming
Jones getting targeted nearly two times per game more than last
year isn't breaking news): Hooper should finish as a top-15 tight
end. Even if Gabriel doesn't see his role in the offense scaled
back (I believe he will), Jacob Tamme leaves behind 31 targets
from last year and finished with 81 in 2015. That alone is enough
for Hooper to make the jump.
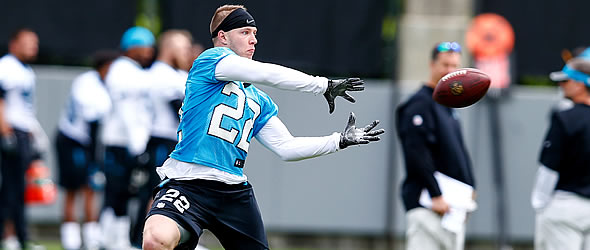
McCaffrey performing like a rich-man's
Danny Woodhead would be just fine for fantasy owners.
2017 Projected Total Offensive Plays: 1,069 2016 Total: 1,052
Perhaps no team has beat the drum to their own philosophical
change more than the Panthers. Perhaps no player on their team
is creating more of an "I have no idea what he is going to
do in 2017" response than McCaffrey. While things in the
NFL are never as simple or complicated as we make them, asking
McCaffrey to average 4.75 targets in a role he was drafted to
fill and 10 carries as the backup running back in an offense that
usually pushes 500 carries AND is trying to reduce the number
of hits on Newton isn't asking too much. Maybe the rookie is nothing
more than a rich man's Danny Woodhead this season, but is that
so bad if that is his floor? His ceiling? How about 250 carries
and 70-80 catches if Stewart succumbs to injury early. (I'm not
kidding.) I'm going to go out on a limb and say there is only
about a five-percent chance he disappoints owners at his current
early fourth-round ADP in PPR formats if he plays in all 16 games.
2017 Projected Total Offensive Plays: 962 2016 Total: 967
Howard seems to have halted HC John Fox's insistence on committee
backfields for now, so I'll turn my attention to the receiver
position. I was tempted to make White the top receiver in this
offense given the Bears' desire to feature him in 2016, but Glennon's
recent
recommendation of Meredith has me believing the offense will
instead give the former undrafted free agent every chance to follow
up on last season's unexpected success. Of course, it helps White
has yet to stay healthy for any length of time. If he manages
to do so in 2017, then Chicago should have a pair of 100-target
receivers and some long-term stability at the position. Obviously,
I'm expecting less than a full slate from White above and a bunch
of complementary production everywhere else. And no, I didn't
forget Zach Miller. Given his age, injury history and where the
team is at in terms of its readiness to compete, I don't expect
him to make the team.
2017 Projected Total Offensive Plays: 985 2016 Total: 1,010
The league's refusal to completely drop the Elliott investigation
suggests a suspension is coming. A loss of G Ronald Larry and
RT Doug Free makes trusting the venerable Cowboys' offensive line
a bit tougher, even if they did keep their most important assets.
Last but not least, Dallas' secondary was ransacked in the offseason,
and while the additions the team made to its defensive backfield
should end up being a net positive, asking for it to show in Year
1 is a bit much. All this is to suggest the Cowboys may be force
to play from behind a bit more often in 2017. Will Dallas respond
by making it Dak's team? If so, it may be a mistake, and not because
Prescott can't possibly maintain his level of play, because I
think he can. First and foremost, the schedule is ridiculously
difficult for Bryant (something we'll go into more detail next
week), so any downturn in game script and/or offensive line play
could sink this offense in a big way.
2017 Projected Total Offensive Plays: 982 2016 Total: 981
Abdullah was an absolute workhorse at Nebraska, but the Lions
have given little indication they plan on using him the same way
through two seasons (albeit he was limited to two games in 2016).
Since OC Jim Bob Cooter took over the play-calling duties prior
to Week 10 of the 2015 season, Abdullah has yet to carry the ball
more than 16 times. In those 10 games in which Abdullah has suited
up, he has as many games with fewer than 10 carries as he has
double-digit carry games (five apiece). Since the team did not
address that position in the draft, one can only assume they like
what they have on the depth chart and/or have no interest in making
much of a commitment to the ground game. Considering the Lions'
significant holes on defense, it may not matter if they were.
2017 Projected Total Offensive Plays: 1,004 2016 Total: 1,029
In fantasy, we tend to associate volume with production. Most
of the time that is case, but Rodgers is all about efficiency
and always has been. His 610 pass attempts in 2016 were easily
a career high, so don't expect that to happen again this year.
(His previous career high was 572 in 2015.) HC Mike McCarthy believes
in a strong running game (435 attempts each of the previous two
seasons before 374 last year), so owners can count on the Packers
to find a way to run the ball 27 or 28 times on average in 2017.
McCarthy threw
his support behind Montgomery in a recent interview with NFL
Network and seemed to attribute his lack of effectiveness in pass
protection to lack of reps, which seems like a convenient thing
to do before the season starts and a blown assignment leads to
Rodgers getting blindsided. Williams remains a savvy late-round
pick and strong candidate to end up splitting work with Montgomery
by the second half the season, but it appears to be (mostly) Montgomery's
show for now.
2017 Projected Total Offensive Plays: 975 2016 Total: 960
It's a sad state of affairs when the health (or lack thereof)
of Dunbar swings the pendulum in the right direction for a talent
like Gurley, but the former's knee injury - the extent of which
has yet to be determined - on July 31 may be just what the latter
needed to see the kind of passing-game involvement he should have.
Making the offense less predictable (by keeping the same back
in the game the majority of the time) is something the Rams should
be striving for given their receiving corps, which would be a
solid group if it was serving as a complement to a star wideout.
At any rate, Woods is easily the best bet of this bunch to reach
a 20-percent target share playing the Pierre Garçon role
in HC Sean McVay's offense. If the Rams become the latest in a
long line of DC Wade Phillips' defenses to enjoy huge success
in his first year with a team, then McVay can probably afford
Kupp to be strictly a chain-moving slot receiver in the Jamison
Crowder mold as a rookie.
2017 Projected Total Offensive Plays: 981 2016 Total: 1,006
Assuming OC Pat Shurmur decides to keep the same small-ball offense
he employed last year intact and Diggs can stay healthy for 16
games, he has a great chance to finish among the top 10 receivers
in PPR formats. But the bigger story (and value) could/should
be Thielen, who was already on an 80-target pace last season before
averaging 10 over his final four complete/healthy games. Some
may question whether he can maintain a heavy target share given
the possible/likely improvement from Treadwell and possibly Floyd,
but those two big-bodied receivers are more likely to steal a
few red zone looks from Rudolph than eat into Thielen's looks
down the field.
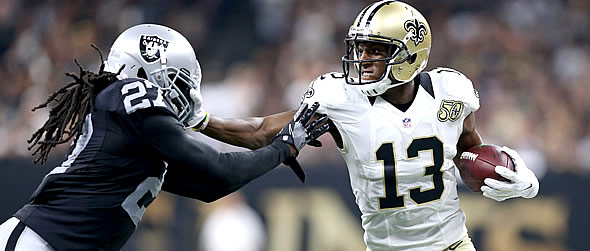
If the Saints get their running game rolling,
there won't be much room for Thomas' targets to increase.
2017 Projected Total Offensive Plays: 1,071 2016 Total: 1,105
During the Brees/Sean Payton era, no receiver has ever topped
a 23-percent target share. That's still a pretty high bar, mind
you, but if the Saints get their running game rolling like they
want to, there won't be much more room for Thomas' targets to
increase, even if his share does. (He was at 18.2 percent last
year for an offense that threw the ball 674 times.) Snead's piece
of the pie is going to increase and Ginn should be good for at
least 50-60 percent of Ginn's old 110-120 targets. It all boils
down to whether Brees will, for the first time as a Saint, force-feed
the ball to one receiver. History says he won't, so owners should
be happy if Thomas simply matches last year's production.
2017 Projected Total Offensive Plays: 1,003 2016 Total: 1,018
Beckham getting a 25-percent target share should be pretty much
a guaranteed thing barring injury. How the shares are divided
after that is the big question. My reference point for this year's
offense is HC Ben McAdoo's first Giants' offense in 2014, which
found a way to pepper Rueben Randle with 127 targets and Beckham
with 130 despite the fact he missed the first four games of the
season. Larry Donnell even chipped a mindboggling 92 targets.
In other words, there should be more than enough volume for two
high-end fantasy receivers and enough left over for Shepard to
be in the WR4 conversation. And if Manning is anywhere as inconsistent
this season as he was in 2016, volume is going to be important.
2017 Projected Total Offensive Plays: 1,000 2016 Total: 1,080
The Eagles' primary objectives this offseason were to surround
Wentz with playmakers while reducing the degree to which he needs
to carry the offense. Check and check. Balance figures to be key
in the passing game, especially considering the brutal slate Jeffery
has in front of him, and it should come as no surprise if Philadelphia
fails to have one receiver top 100 targets. The same balance may
apply to the running back position, which could easily see three
players amass at least 100 touches. Obviously, a relative lack
of opportunity for everybody makes this offense, which should
be substantially better in 2017, one in which they are several
fantasy-viable players. However, it is possible none of them will
consistently deliver the goods on an every-week basis.
2017 Projected Total Offensive Plays: 984 2016 Total: 996
I'm torn on Hyde, and it has everything to do with new HC Kyle
Shanahan's recent comments about him. Hyde hasn't shown an ability
to thrive in anything outside of a shotgun-based running offense
(Ohio State and Chip Kelly's offense last year), plus I don't
think he can thrive in an outside zone-running scheme. Last but
not least, his penchant for missing multiple games makes him a
tough player to recommend. I was willing to look past GM John
Lynch's comments
over the weekend about Hyde's conditioning as an executive
doing what he can to increase trade value, but I take Shanahan's
praise a bit more seriously. Does conditioning and commitment
make Hyde a better player, and perhaps just as importantly, a
better fit for Shanahan's offense? It can't hurt, and it may even
allow him to play a full schedule. Consider me still very skeptical,
but less so than I have been since the team drafted Williams.
2017 Projected Total Offensive Plays: 989 2016 Total: 1,012
The Seahawks want to run the ball 500 times. In fact, last year
marked the first time since 2011 they failed to do so. Granted,
it helps Wilson usually supplies about 20 percent of that total,
but the running game is a priority to be sure. Figuring out how
Seattle will split the other 400 attempts with a trio of injury-prone
running backs is the real mystery. Owners are playing it smart
by not pretending Lacy is going to be the next Marshawn Lynch,
but Lacy's contract is a clear indication the team wants him to
be the leader of the backfield. The Seahawks probably need to
protect Rawls from himself, as his maniacal running style opens
him up to a ton of punishment. As far as Prosise is concerned,
would anyone be surprised if we are talking about him next year
in the same way we are talking about Ty Montgomery this year?
I wouldn't. In the end, Seattle would probably be happy with all
three backs getting at least 100 touches and enjoy the problem
of figuring out how to split the remaining 100-150 three ways.
2017 Projected Total Offensive Plays: 1,019 2016 Total: 1,066
While the Buccaneers continue to send mixed messages on what
they plan on doing with their backfield to open the season and
following Martin's return, we'll focus on the receivers. Evans
drew 173 targets last year but only 70 during the team's 6-2 finish.
It's hard to believe a team that wants to run the ball and just
added Jackson will lead to increased looks for Evans. Fortunately
for Evans and Jackson, Tampa Bay added O.J. Howard and figures
to run even more two-tight sets than last year (the Bucs ranked
second in the league with 329 snaps in "12" personnel,
using one back and two tight ends 31 percent of the time), keeping
players like Humphries from stealing their targets. Regardless,
Evans will likely need an injury to Jackson in order to have any
chance at coming close to repeating last season's fantasy production.
2017 Projected Total Offensive Plays: 1,008 2016 Total: 1,009
Few teams have one position in which the perceived backup (or
complementary piece) could ultimately become the most valuable
player from that team at that position in fantasy. The Redskins
have two. Perine is a second-stringer at the moment but the favorite
for goal-line work in what should be a good offense. Kelley has
reportedly done everything in his power to improve his game and
certainly caught the eye of HC Jay Gruden. Thompson appears to
have no challenger for work on passing downs. It would be one
thing if Washington had a stout enough defense to play conservatively
in order to give its backfield 500 carries, but that's probably
not going to be the case. Despite his improved physique, Kelley
is still a league-average talent until proven otherwise and best
suited to be a complementary back. Thompson is pretty much already
locked into a complementary role himself, so the easy deduction
could (should?) be that Perine will pass Kelley on the depth chart
at some point.
Pryor is an easy player to love given his story and extraordinary
athleticism, but he figures to suffer from the same schedule-related
syndrome Dez Bryant and Alshon Jeffery will. (Again, we'll cover
this next week.) So while goes in the mid-to-late third round
of fantasy drafts and gets off to a good start this season, owners
should rest easy when he faces perhaps the most challenging run
of pass defenses any receiver will face in November and December.
To be clear, Crowder isn't getting off easy himself late in the
year, but he was already being counted upon to assume a huge role
in this offense anyway and won't draw primary coverage from "shadow"
corners. He didn't need the benefit of lining up in the slot (which
he will) or an easier slate to help him see more targets than
Pryor, but he is going to have that working in his favor as well.
Unless Pryor takes on an OBJ-like role in this offense or Crowder
gets hurt, Crowder is the Washington receiver owners should want
in fantasy come playoff time.
Doug Orth has written for FF
Today since 2006 and been featured in USA Today’s Fantasy
Football Preview magazine since 2010. He hosted USA Today’s
hour-long, pre-kickoff fantasy football internet chat every Sunday
in 2012-13 and appears as a guest analyst on a number of national
sports radio shows, including Sirius XM’s “Fantasy Drive”.
Doug is also a member of the Fantasy Sports Writers Association.